Wausau has been losing students for years
Here's what it means, and how it compares to other districts
If you’re not in education, you might not know that on the third Friday of September, school districts across the state take a headcount of all their students and report that number to the Department of Public Instruction.
The count is about more than butts in seats. The numbers are important because the state uses the count to determine funding. How much? Wausau School District Finance Director Robert Tess says it’s a complicated formula, but $10,000 per student is a good round number. In fact it’s actually WAY more complicated than that, but for now let’s stick with the idea that overall it’s generally good to gain students and bad to lose them.
With that in mind, this chart might look a little staggering:
This graph is based on this year’s third Friday counts DPI does every year. I struggled with a way to demonstrate how volatile the counts have been, without making the less extreme examples look more extreme. The above is at least an accurate depiction, though none looks as startling as some of the figures should.
For example, if D.C. Everest’s enrollment looks pretty steady, that’s because it is. The trend line is almost completely flat. Especially compared to Wausau’s, which has had one of the largest declines of district’s I’ve studied.
(In case you’re wonder, these data visualizations are coded in Python on the Replit platform, an online developer environment. So the numbers are accurately represented via code, not an artistic interpretation.)
Wausau’s enrollment dropped from 8,382 students in 2017 to only 7,991. That’s a drop of 391 students, or 4.6% drop from 2017.
Merrill represents an even bigger percentage loss. Merrill went from 3,263 students in 2017 to 3,023 this year. That’s a loss of 240 students — not as much as Wausau’s, but a higher percentage at 7.3%.
A couple of things that are important to note — both Wausau and Merrill lost students in 2020 during the COVID pandemic. Many were unhappy with the school district’s slow path to reopening and left the district for others with more open COVID policies. I wasn’t following Merrill’s to know if that was also the case. SPASH, down in Stevens Point, saw similar declines.
That said, in Wausau’s case, the downward trend had been continuing. In fact, this is one of the great things about data visualizations. Although the Friday count numbers improved in 2021 over 2020, the enrollment numbers in 2021 were in line with the decline. One could draw a ruler over the decline, and the ruler would predict where 2021’s enrollment numbers would fall, the COVID dip only a temporary deviation from the trendline.
It’s also important to note that the state numbers have been falling as well. Enrollment went from 852,180 in 2017 to 814,101 this year. That’s a loss of 38,079 students, nearly the population of Wausau. That’s a 4.4% loss, just a little less than the percentage of students Wausau lost.
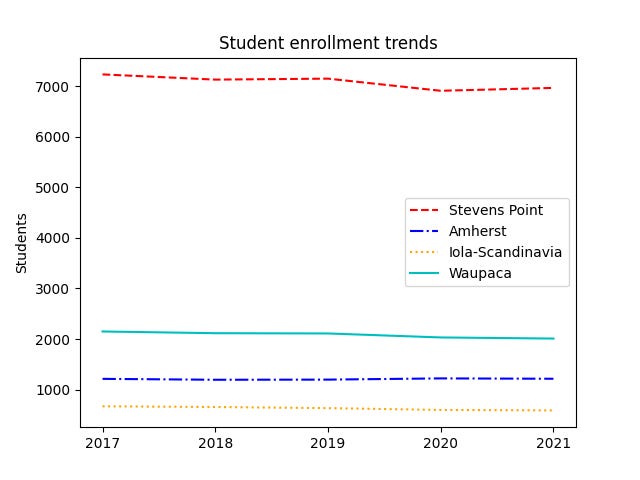
This is playing out in the Stevens Point area as well. Stevens Point Area School District looks similar:


